Monitoring
LoadPilot exposes a Prometheus metrics endpoint and ships a pre-provisioned Grafana dashboard that updates in real time during a test run.
Grafana Dashboard
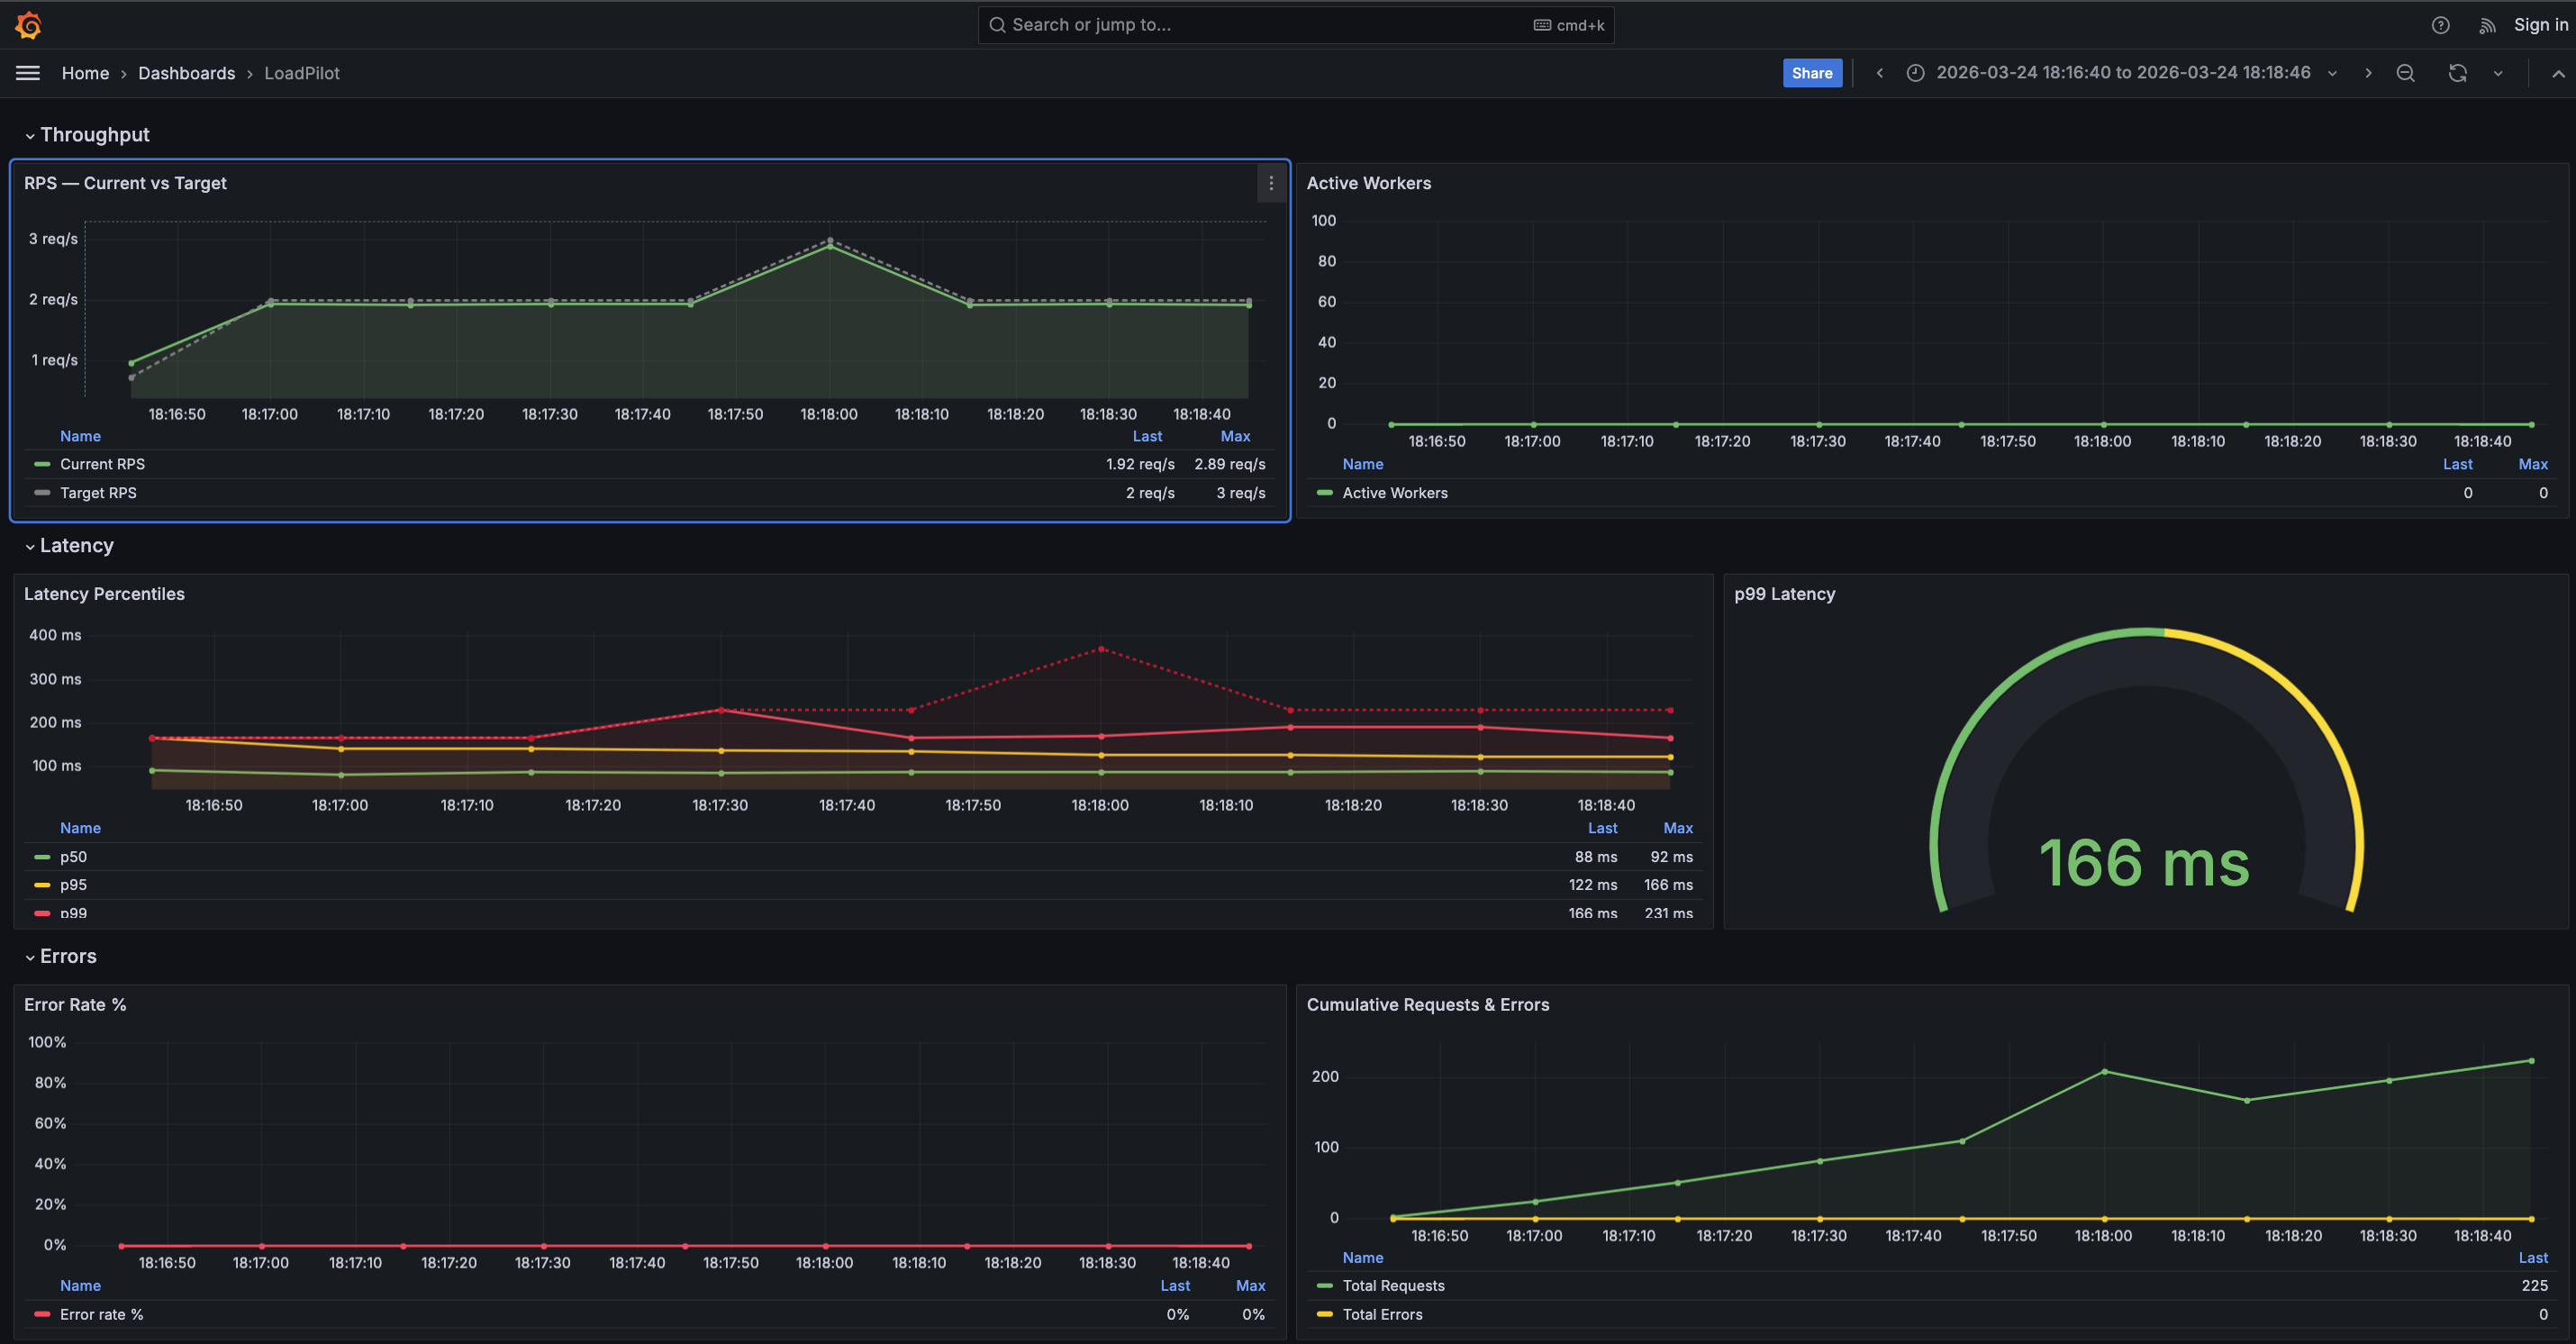
The dashboard has four sections:
| Section | Panels |
|---|---|
| Throughput | RPS — Current vs Target, Active Workers |
| Latency | Latency Percentiles (p50 / p95 / p99 / max), p99 gauge |
| Errors | Error Rate %, Cumulative Requests & Errors |
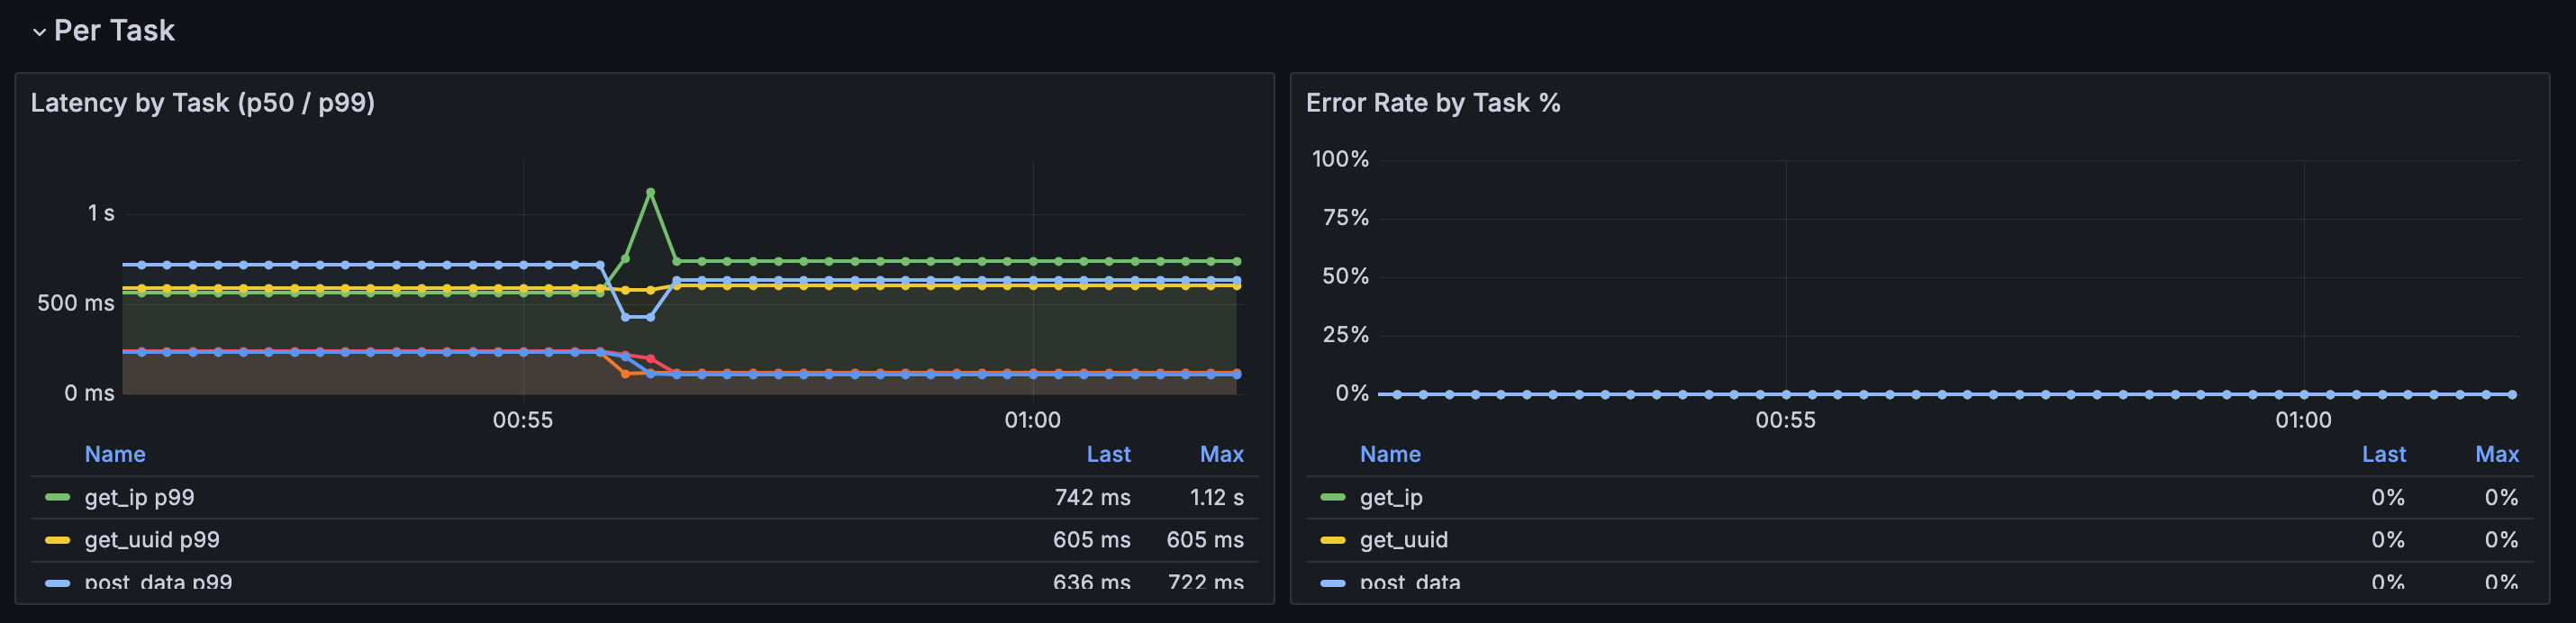
| Per Task | Latency by Task (p50 / p99), Error Rate by Task % |
The Per Task section is populated automatically when a scenario defines multiple
named @task methods. A $task template variable lets you filter by individual
endpoints. Tasks appear in the legend as soon as the first scrape completes.
Prometheus metrics
The coordinator exposes metrics at :9090/metrics during a run:
| Metric | Description |
|---|---|
loadpilot_current_rps | Observed request rate |
loadpilot_target_rps | Configured target RPS |
loadpilot_active_workers | Active VUser threads |
loadpilot_latency_p50_ms | p50 latency (ms) |
loadpilot_latency_p95_ms | p95 latency (ms) |
loadpilot_latency_p99_ms | p99 latency (ms) |
loadpilot_latency_max_ms | Max latency (ms) |
loadpilot_requests_total | Cumulative request count |
loadpilot_errors_total | Cumulative error count |
Per-task metrics
When a scenario has named tasks the coordinator also emits per-task metrics with
a task label:
| Metric | Description |
|---|---|
loadpilot_task_requests_total{task="..."} | Cumulative requests for this task |
loadpilot_task_errors_total{task="..."} | Cumulative errors for this task |
loadpilot_task_latency_p50_ms{task="..."} | p50 latency for this task (ms) |
loadpilot_task_latency_p99_ms{task="..."} | p99 latency for this task (ms) |
loadpilot_task_latency_mean_ms{task="..."} | Mean latency for this task (ms) |
Task names come from the method names of @task-decorated functions in your
scenario class.
Local setup (single machine)
loadpilot run scenarios/checkout.py --target https://api.example.com
The coordinator starts automatically. Forward Prometheus and open Grafana:
# Grafana ships embedded in the HTML report — open after the run:
open results/report.html

# Or run Prometheus + Grafana separately and point them at :9090
Kubernetes (Helm)
The Helm chart deploys Prometheus and Grafana with the dashboard pre-provisioned. See Development → Helm Chart for install instructions.
# Forward Grafana to localhost
kubectl port-forward -n loadpilot svc/loadpilot-grafana 3000:3000
Then open http://localhost:3000 — login admin / <adminPassword>.
Coordinator in-cluster (recommended)
Deploy the coordinator as a persistent pod so Prometheus can scrape it from inside the cluster — no host networking hacks required:
# Build and load the coordinator image
docker build -f engine/Dockerfile.coordinator -t loadpilot-coordinator:local .
kind load docker-image loadpilot-coordinator:local --name <cluster-name>

# Deploy with coordinator enabled
helm upgrade loadpilot cli/loadpilot/charts/loadpilot \
  -n loadpilot --reuse-values \
  --set coordinator.enabled=true \
  --set coordinator.image=loadpilot-coordinator \
  --set coordinator.tag=local \
  --set coordinator.imagePullPolicy=Never

# Port-forward coordinator API and run via it
kubectl port-forward -n loadpilot svc/loadpilot-coordinator 8080:8080
loadpilot run scenarios/checkout.py \
  --target https://api.example.com \
  --coordinator-url http://localhost:8080
Prometheus scrapes loadpilot-coordinator:9090 in-cluster automatically when
coordinator.enabled=true.
Coordinator running locally (alternative)
To scrape a coordinator running on the host machine:
helm upgrade loadpilot cli/loadpilot/charts/loadpilot \
  --set monitoring.coordinator.scrapeTarget=host.docker.internal:9090