LoadPilot
Write load tests in Python. Run them at Rust speed.
LoadPilot is a load testing tool with a Python DSL for writing scenarios and a Rust execution engine for running them with minimal overhead.
pip install loadpilot
Quick example
from loadpilot import VUser, scenario, task, LoadClient

@scenario(rps=50, duration="1m")
class HealthCheck(VUser):

    @task
    def ping(self, client: LoadClient):
        client.get("/health")
loadpilot run scenarios/health.py --target https://your-api.example.com
Features
- Python scenarios — write tests in plain Python, no YAML or XML
- Rust execution engine — low-overhead HTTP engine built on Tokio + reqwest
- Live TUI — real-time RPS, latency percentiles (p50/p95/p99), and error rate
- Load profiles — ramp, constant, step, spike
- Distributed mode — scale across multiple machines with a single flag
- SLA thresholds — fail CI automatically on p99 or error rate breaches
- Grafana dashboard — Prometheus metrics + pre-built dashboard, zero config
- HTML reports — self-contained report file after every run
Get started
→ Getting Started — install and run your first test in 5 minutes
→ DSL Reference — @scenario, VUser, LoadClient, thresholds
→ CLI Reference — all flags and commands
→ Distributed Mode — scale across machines
→ Benchmark — how LoadPilot compares to Locust and k6
Getting started in 5 minutes
Prerequisites
- Python 3.12+
- An HTTP service to test against
- Platform: Linux x86_64, macOS (Intel or Apple Silicon), Windows x86_64
Install
pip install loadpilot
Or with uv:
uv tool install loadpilot
1. Scaffold a project
loadpilot init my-load-tests
cd my-load-tests
This creates:
my-load-tests/
  scenarios/
    example.py               ← starter scenario
  monitoring/
    docker-compose.yml       ← Prometheus + Grafana, pre-configured
    grafana-dashboard.json   ← LoadPilot dashboard, auto-imported
  .env.example
2. Start live monitoring (optional)
Your project includes a ready-to-use Grafana + Prometheus stack:
docker compose -f monitoring/docker-compose.yml up -d
Open http://localhost:3000 → Dashboards → LoadPilot.
The dashboard auto-imports on first start — no manual setup. Grafana shows RPS, latency percentiles, and error rate in real time while a test runs.
Requires Docker with Compose v2 (
docker composenotdocker-compose).
3. Write your first scenario
Open scenarios/example.py. You’ll see a working example. Here’s the minimal version:
from loadpilot import VUser, scenario, task, LoadClient

@scenario(rps=10, duration="30s")
class HealthCheck(VUser):

    @task
    def ping(self, client: LoadClient):
        client.get("/health")
Replace /health with an endpoint on your service. That’s it — LoadPilot will infer the method and URL automatically.
4. Run it
loadpilot run scenarios/example.py --target https://your-api.example.com
You’ll see a live dashboard:
LoadPilot — HealthCheck  [00:12]  ramp: 4/10 RPS

  Requests/sec:       4.0      Total:        48
  Errors:             0.0%     Failed:         0

  Latency:
    p50:   28ms
    p95:   41ms
    p99:   89ms
    max:  203ms

  [████░░░░░░░░░░░░░░░░]  20%
Press Ctrl+C to stop early.
5. Interactive mode
If you run loadpilot run without a file, you get a scenario browser:
loadpilot run --target https://your-api.example.com
Pick a file, then pick a scenario from the list. Useful when you have multiple scenarios and don’t want to remember their names.
6. Save a report
loadpilot run scenarios/example.py \
  --target https://your-api.example.com \
  --report report.html
Opens in any browser — no server required.
Next steps
Set SLA thresholds
Fail CI automatically if latency or error rate exceeds your SLA:
@scenario(
    rps=50,
    duration="1m",
    thresholds={"p99_ms": 500, "error_rate": 1.0},
)
class HealthCheck(VUser): ...
Exit code 1 on breach. Override from the CLI without changing the file:
loadpilot run scenarios/example.py \
  --target https://staging.api.example.com \
  --threshold p99_ms=800
Add authentication
@scenario(rps=50, duration="1m")
class AuthenticatedFlow(VUser):

    def on_start(self, client: LoadClient):
        resp = client.post("/auth/login", json={"username": "test", "password": "secret"})
        self.token = resp.json()["access_token"]

    @task
    def browse(self, client: LoadClient):
        client.get("/api/products", headers={"Authorization": f"Bearer {self.token}"})
on_start runs once per virtual user before tasks begin.
Choose a load profile
@scenario(rps=100, duration="2m", mode="constant")   # full load immediately
@scenario(rps=100, duration="2m", mode="ramp")        # linear ramp (default)
@scenario(rps=100, duration="2m", mode="step", steps=5)  # staircase
@scenario(rps=100, duration="2m", mode="spike")       # 20% → 100% → 20%
Run distributed
Scale across multiple machines:
# 4 local processes
loadpilot run scenarios/example.py --target https://api.example.com --agents 4

# External agents on remote machines
loadpilot run scenarios/example.py \
  --target https://api.example.com \
  --external-agents 4
Live Grafana metrics
The monitoring/ directory scaffolded by loadpilot init gives you a full observability stack:
docker compose -f monitoring/docker-compose.yml up -d
# Prometheus → http://localhost:9091
# Grafana    → http://localhost:3000  (admin / admin)
The LoadPilot dashboard auto-imports on first start. It shows RPS (actual vs target), latency percentiles, active workers, and error rate — updated every 2 seconds while a test runs.
DSL Reference
@scenario
| Parameter | Type | Default | Description |
|---|---|---|---|
rps | int | 10 | Target RPS at peak load. Must be > 0. |
duration | str | "1m" | Steady-state duration for ramp; total for other modes. Must be > 0. |
ramp_up | str | "10s" | Ramp-up window (used only by mode="ramp"). Must be ≤ duration. |
mode | str | "ramp" | Load profile: ramp, constant, step, spike |
steps | int | 5 | Number of steps for mode="step". Must be ≥ 1. |
thresholds | dict[str, float] | {} | SLA limits — exit code 1 if breached |
Load profiles
| Mode | Behaviour |
|---|---|
ramp | Linear ramp 0 → target RPS over ramp_up, then steady. Total = duration + ramp_up. |
constant | Full RPS immediately, no ramp. Total = duration. |
step | Divide duration into steps equal windows; RPS increases each step. |
spike | Thirds: 20% RPS (baseline) → 100% RPS (spike) → 20% RPS (recovery). |
@scenario(rps=100, duration="2m", ramp_up="15s", mode="ramp")    # default
@scenario(rps=100, duration="2m", mode="constant")
@scenario(rps=100, duration="2m30s", mode="step", steps=5)
@scenario(rps=100, duration="2m", mode="spike")
All profiles work in distributed mode.
@task
| Parameter | Type | Default | Description |
|---|---|---|---|
weight | int | 1 | Relative frequency vs other tasks. Must be > 0. |
Tasks with higher weight are called proportionally more often. A scenario with
@task(weight=5) def browse and @task(weight=1) def purchase will call browse
5 times for every 1 call to purchase.
A scenario must define at least one @task method. HTTP methods used inside tasks
must be one of GET, POST, PUT, PATCH, DELETE.
Tasks can be async def — LoadPilot drives them with a coro.send(None) fast path
that avoids asyncio scheduling overhead for sync-body coroutines, with automatic
fallback to run_until_complete for tasks that contain real await expressions.
Lifecycle hooks
| Method | When | Client |
|---|---|---|
on_start(self, client) | Once per virtual user, before tasks start | Real HTTP (httpx) |
on_stop(self, client) | Once per virtual user, after test ends | Real HTTP (httpx) |
check_{task}(self, status_code, body) | After each task’s last HTTP response | — |
on_start
Runs once per virtual user before any tasks are dispatched. Use it for authentication, session setup, or any per-user state.
def on_start(self, client: LoadClient):
    resp = client.post("/auth/login", json={"username": "test", "password": "secret"})
    self.token = resp.json()["access_token"]
In distributed mode on_start runs on the coordinator, captures per-VUser headers,
and ships them with the plan. Agents rotate through pre-authenticated header sets in
pure Rust — no Python required on agents.
check_{task}
Called after each invocation of the matching task, with the status code and parsed JSON body of the last HTTP call made inside that task. Raise any exception to count the request as an error.
@task(weight=1)
def browse(self, client: LoadClient):
    client.get("/api/products", headers=self._auth())

def check_browse(self, status_code: int, body) -> None:
    assert status_code == 200
    assert isinstance(body, list)
If no check_{task} is defined, errors are determined by HTTP status code (≥ 400 = error).
In distributed mode
check_*is intentionally skipped — at high RPS the signal is status code, latency, and throughput, not body content.
LoadClient
Thin wrapper around httpx.
client.get(path, **kwargs)
client.post(path, **kwargs)
client.put(path, **kwargs)
client.patch(path, **kwargs)
client.delete(path, **kwargs)
All methods accept the same keyword arguments as httpx (headers, json, data,
params, timeout, etc.). path is relative to the --target base URL.
ResponseWrapper attributes: .status_code, .ok, .text, .headers,
.json(), .elapsed_ms, .raise_for_status().
client.batch(requests) — concurrent requests in one PyO3 call
Execute N HTTP requests concurrently inside Rust, releasing the GIL for the entire batch. Useful when a task makes multiple independent requests and latency matters.
@task(weight=1)
def fetch_profile(self, client: LoadClient):
    auth = {"Authorization": f"Bearer {self.token}"}
    responses = client.batch([
        {"method": "GET", "path": "/api/user",   "headers": auth},
        {"method": "GET", "path": "/api/orders", "headers": auth},
        {"method": "GET", "path": "/api/cart",   "headers": auth},
    ])
    # responses is a list of ResponseWrapper in dispatch order
Each dict accepts: method (default "GET"), path, headers, json, data.
At batch size 5 this reaches 97% of static-mode ceiling (+45% vs sequential).
Multiple tasks per scenario
@scenario(rps=100, duration="2m")
class CheckoutFlow(VUser):

    @task(weight=5)
    def browse(self, client: LoadClient):
        client.get("/api/products", headers=self._auth())

    @task(weight=1)
    def purchase(self, client: LoadClient):
        client.post("/api/orders", json={"product_id": 42, "qty": 1},
                    headers=self._auth())
Multiple HTTP calls inside a task
@task(weight=1)
def checkout(self, client: LoadClient):
    cart = client.get("/cart", headers=self._auth())
    item_id = cart.json()["items"][0]["id"]
    client.post("/orders", json={"item_id": item_id, "qty": 1}, headers=self._auth())

def check_checkout(self, status_code: int, body) -> None:
    assert status_code in (200, 201)
Each HTTP call inside a task is measured independently. check_checkout receives
the status code and parsed JSON body of the last call.
Multiple scenarios in one file
@scenario(rps=30, duration="1m")
class LightFlow(VUser): ...

@scenario(rps=100, duration="2m", mode="spike")
class HeavyFlow(VUser): ...
loadpilot run scenarios/flows.py --scenario HeavyFlow --target https://api.example.com
# omit --scenario to pick interactively
SLA thresholds
@scenario(
    rps=100,
    duration="2m",
    thresholds={
        "p99_ms":     500,   # p99 latency must be < 500ms
        "p95_ms":     300,
        "error_rate": 1.0,   # error rate must be < 1%
    },
)
After the test:
Thresholds
  ✓  p99 latency       243ms  <  500ms
  ✓  p95 latency       158ms  <  300ms
  ✓  error rate          0%   <    1%

All thresholds passed.
Exit code 1 on breach. Override from CLI without editing the file:
loadpilot run scenarios/health.py \
  --target https://staging.api.example.com \
  --threshold p99_ms=800 \
  --threshold error_rate=2
CLI Reference
Commands
loadpilot run [SCENARIO_FILE] [OPTIONS]
loadpilot compare CURRENT [BASELINE] [OPTIONS]
loadpilot init [DIRECTORY]
loadpilot version
loadpilot run
Run a load test scenario.
Omit SCENARIO_FILE to open the interactive scenario browser (requires a TTY).
loadpilot run scenarios/checkout.py --target https://api.example.com
Options
| Flag | Default | Description |
|---|---|---|
--target | http://localhost:8000 | Base URL of the system under test |
--scenario | — | Scenario class name (required when a file defines multiple @scenario classes) |
--report | off | Write an HTML report to this path after the test |
--dry-run | off | Validate the scenario and print the generated plan JSON, then exit without running |
--agents | 1 | Spawn N local agent processes (embedded NATS) |
--external-agents | 0 | Wait for N externally started agents to connect before starting |
--nats-url | — | Connect to an external NATS server (use with --external-agents) |
--threshold | from @scenario | Override an SLA threshold at run time: --threshold p99_ms=500 |
--results-json | off | Write final metrics as JSON to this path |
--save-baseline | off | Save results as baseline to .loadpilot/baseline.json |
--coordinator-url | — | URL of an in-cluster coordinator (POST /run). When set the coordinator runs as a k8s pod instead of a local subprocess. Also readable from LOADPILOT_COORDINATOR_URL. |
Scenario validation
LoadPilot validates the scenario plan before starting the coordinator. If the plan is invalid, the test does not run and errors are printed immediately:
Scenario validation failed:
  • rps: rps must be > 0, got 0
  • target_url: target_url must start with http:// or https://, got 'localhost:8080'
  • plan: ramp_up (90s) exceeds duration (30s)
The following constraints are enforced:
| Field | Constraint |
|---|---|
rps | > 0 |
duration | > 0 |
ramp_up | ≥ 0 and ≤ duration |
target_url | must be a valid http:// or https:// URL |
| tasks | at least one @task method required |
task weight | > 0 |
task method | one of GET, POST, PUT, PATCH, DELETE |
Use --dry-run to check validation without running the test.
Examples
# basic run
loadpilot run scenarios/checkout.py --target https://api.example.com

# save HTML report
loadpilot run scenarios/checkout.py \
  --target https://api.example.com \
  --report results/report.html

# override threshold without editing the file
loadpilot run scenarios/checkout.py \
  --target https://staging.example.com \
  --threshold p99_ms=800

# distributed — 4 local processes
loadpilot run scenarios/checkout.py \
  --target https://api.example.com \
  --agents 4

# distributed — external agents
loadpilot run scenarios/checkout.py \
  --target https://api.example.com \
  --external-agents 2 \
  --report results/report.html

# dry-run: validate the scenario and inspect the generated plan JSON
loadpilot run scenarios/checkout.py --target https://api.example.com --dry-run

# save baseline for future comparisons
loadpilot run scenarios/checkout.py --target https://api.example.com --save-baseline

# run via in-cluster coordinator (k8s)
kubectl port-forward -n loadpilot svc/loadpilot-coordinator 8080:8080
loadpilot run scenarios/checkout.py \
  --target https://api.example.com \
  --coordinator-url http://localhost:8080
loadpilot compare
Compare two results JSON files and show metric deltas. Useful for detecting regressions after a deploy or code change.
loadpilot compare current.json
loadpilot compare current.json baseline.json
If BASELINE is omitted, LoadPilot reads .loadpilot/baseline.json (saved by --save-baseline).
Options
| Flag | Default | Description |
|---|---|---|
--threshold | 10 | Fail with exit code 1 if any metric regressed by more than this % |
Output
Comparing baseline.json → current.json

                    baseline       current         diff
  RPS actual          498.2         501.1        +0.6%
  p50 latency           12ms          9ms       -25.0%
  p95 latency           28ms         25ms       -10.7%
  p99 latency           41ms         38ms        -7.3%
  error rate           0.00%        0.00%           —

No regressions detected.
Green = improvement, red = regression. Exit code 1 if any metric regressed
beyond --threshold.
Typical workflow
# 1. save baseline once (or after intentional improvement)
loadpilot run scenarios/checkout.py --save-baseline

# 2. run after changes
loadpilot run scenarios/checkout.py --results-json current.json

# 3. compare
loadpilot compare current.json

# 4. in CI — fail on > 5% regression
loadpilot compare current.json --threshold 5
.loadpilot/baseline.json is gitignored by default. Commit it if you want
to share the baseline with your team.
loadpilot init
Scaffold a new load test project.
loadpilot init my-load-tests
cd my-load-tests
Creates:
my-load-tests/
  scenarios/
    example.py               ← starter scenario (edit this)
  monitoring/
    docker-compose.yml       ← Prometheus + Grafana, pre-configured
    grafana-dashboard.json   ← LoadPilot dashboard, auto-imported on first start
  .env.example
Safe to run on an existing directory — does not overwrite files that already exist.
Start live monitoring
docker compose -f monitoring/docker-compose.yml up -d
# Grafana    → http://localhost:3000  (admin / admin)
# Prometheus → http://localhost:9091
The LoadPilot dashboard auto-imports on first start. It shows RPS (actual vs target), latency percentiles, active workers, and error rate — updated every 2 seconds while a test runs.
Requires Docker with Compose v2 (
docker compose, notdocker-compose).
loadpilot version
Print the installed version and exit.
loadpilot version
Distributed Mode
Run a load test across multiple machines. The CLI output is identical to single-machine mode — the coordinator aggregates all agent metrics transparently.
Local agents
Spawn N agent processes on the same machine sharing an embedded NATS broker:
loadpilot run scenarios/checkout.py --target https://api.example.com --agents 4
Each agent handles rps / N of the total load. Useful for saturating the network
interface or bypassing OS-level connection limits.
External agents — separate machines
Start agents
Install the agent binary on each machine:
curl -fsSL https://raw.githubusercontent.com/VladislavAkulich/loadpilot/main/install.sh | sh
Start an agent — it connects to the coordinator and waits for a plan:
loadpilot-agent --coordinator <coordinator-ip>:4222 --agent-id agent-0
loadpilot-agent --coordinator <coordinator-ip>:4222 --agent-id agent-1
Agents are persistent — after a run completes they reconnect and wait for the next plan automatically.
Run a test
loadpilot run scenarios/checkout.py \
  --target https://api.example.com \
  --external-agents 2 \
  --report results/report.html
The coordinator uses an embedded NATS broker listening on :4222 by default.
Coordinator as a Kubernetes service
Deploy the coordinator as a long-running pod inside the cluster. It exposes an
HTTP API (POST /run) that accepts a plan JSON and streams metric ndjson back.
Prometheus scrapes metrics at :9090 in-cluster — no host networking required.
# Build coordinator image
docker build -f engine/Dockerfile.coordinator -t loadpilot-coordinator:local .
kind load docker-image loadpilot-coordinator:local --name <cluster-name>

# Enable in Helm
helm upgrade loadpilot cli/loadpilot/charts/loadpilot -n loadpilot \
  --reuse-values \
  --set coordinator.enabled=true \
  --set coordinator.image=loadpilot-coordinator \
  --set coordinator.tag=local \
  --set coordinator.imagePullPolicy=Never

# Port-forward the API and run
kubectl port-forward -n loadpilot svc/loadpilot-coordinator 8080:8080
loadpilot run scenarios/checkout.py \
  --target https://api.example.com \
  --coordinator-url http://localhost:8080
The coordinator uses the agents already running in-cluster (controlled by
agent.replicas). The CLI streams the live dashboard exactly as in local mode.
You can also set the URL via environment variable:
export LOADPILOT_COORDINATOR_URL=http://localhost:8080
loadpilot run scenarios/checkout.py --target https://api.example.com
Coordinator HTTP API
| Endpoint | Method | Description |
|---|---|---|
/run | POST | Accept plan JSON, stream ndjson metric lines. Returns 409 if a test is already running. |
/healthz | GET | Readiness probe — returns ok. |
External NATS (Railway / cloud)
Deploy a NATS server separately (e.g. Railway, Fly.io, or a VPS):
# Deploy NATS: Docker image nats:latest, TCP port 4222

# Start agents with COORDINATOR env var pointing at your NATS
COORDINATOR=your-nats.railway.app:PORT AGENT_ID=agent-0 loadpilot-agent

# Run test with external NATS
loadpilot run scenarios/checkout.py \
  --target https://api.example.com \
  --nats-url nats://your-nats.railway.app:PORT \
  --external-agents 2 \
  --report results/report.html
on_start in distributed mode
When a scenario uses on_start (e.g. login → per-user auth token), the coordinator
runs on_start N times locally against the target before the test begins. It
captures the headers and URLs each VUser would set and ships them with the plan.
Agents rotate through these pre-authenticated header sets in pure Rust — no Python
required on agent machines.
@scenario(rps=100, duration="2m")
class CheckoutFlow(VUser):
    def on_start(self, client):
        resp = client.post("/auth/login", json={"user": "test", "pass": "secret"})
        self.token = resp.json()["access_token"]

    @task
    def browse(self, client):
        # self.token from on_start is captured and shipped to agents automatically
        client.get("/api/products", headers={"Authorization": f"Bearer {self.token}"})
Per-VUser URL state
If on_start stores state that influences task URLs (e.g. a resource ID created
during setup), the coordinator captures the resulting URL for each VUser and ships
it as an override. Agents use the per-VUser URL instead of the task’s default:
@scenario(rps=5, duration="2m", ramp_up="20s")
class ProjectCRUDFlow(VUser):
    _lock = threading.Lock()
    _shared_project_id: int | None = None  # one project shared across all VUsers

    def on_start(self, client):
        # login
        super().on_start(client)
        # create the shared project once; all VUsers reuse the same ID
        with self.__class__._lock:
            if self.__class__._shared_project_id is None:
                resp = client.post("/api/v1/projects", json=new_project(), headers=self._auth())
                resp.raise_for_status()
                self.__class__._shared_project_id = resp.json()["id"]
        self.project_id = self.__class__._shared_project_id

    @task(weight=4)
    def read_project(self, client):
        # URL /api/v1/projects/{self.project_id} is captured per-VUser
        # and shipped to agents — agents use the real URL, not "/"
        client.get(f"/api/v1/projects/{self.project_id}", headers=self._auth())
Tip — resource-limited accounts: if your on_start creates a resource and the account has a per-user limit, use a class-level shared resource (as above) so only one object is created regardless of the pre-auth pool size.
on_stop in distributed mode
If on_stop is defined, the coordinator calls it for each pre-authenticated VUser
after the test completes. Use this to delete resources created in on_start:
def on_stop(self, client):
    with self.__class__._lock:
        self.__class__._vuser_count -= 1
        last = self.__class__._vuser_count == 0
    if last and self.__class__._shared_project_id is not None:
        client.delete(
            f"/api/v1/projects/{self.__class__._shared_project_id}",
            headers=self._auth(),
        )
        self.__class__._shared_project_id = None
on_stop is also called during --dry-run to prevent resource leaks from the
pre-auth phase.
Reliability guarantees
- Synchronised start — all agents begin within ~1ms of each other. The
coordinator sends a
start_attimestamp; agents sleep until it fires. - PING/PONG keepalive — agents and coordinator respond to NATS server PING frames so long-running tests (> 2 min) are not disconnected mid-run.
- Agent re-registration — agents re-announce to the coordinator every 3s until they receive a shard, so coordinator and agents can start in any order.
- Agent timeout — if an agent stops reporting for 15s it is marked timed-out; the test continues on remaining agents without hanging.
- Agent recovery — if a timed-out agent reconnects mid-test it is restored to the active pool.
- Fractional RPS budget — the dispatcher accumulates sub-integer request budgets across ticks so low-RPS scenarios (e.g. 3 RPS split across 2 agents) fire the correct number of requests instead of rounding to zero.
Architecture
CLI (Python)
  build plan ──► spawn coordinator subprocess   (local mode)
                   │ stdin (JSON)
               OR
  build plan ──► POST /run to coordinator pod   (--coordinator-url)
                   │ HTTP ndjson stream
                   ▼
Coordinator (Rust)
  ├── embedded NATS broker  (or connect to external NATS)
  ├── wait for N agents to register
  ├── shard plan + set synchronised start_at → publish to each agent
  ├── aggregate metrics (sum RPS, histogram-merged percentiles, per-task)
  ├── stdout / HTTP ndjson → CLI live dashboard
  └── :9090/metrics → Prometheus / Grafana

Agent (Rust, one per machine or k8s pod)
  ├── connect to NATS → register → receive shard
  ├── sleep until start_at (clock sync)
  ├── run HTTP load (token-bucket + reqwest)
  ├── stream metrics + per-task histograms → NATS → coordinator
  └── reconnect and wait for next plan
Monitoring
LoadPilot exposes a Prometheus metrics endpoint and ships a pre-provisioned Grafana dashboard that updates in real time during a test run.
Grafana Dashboard
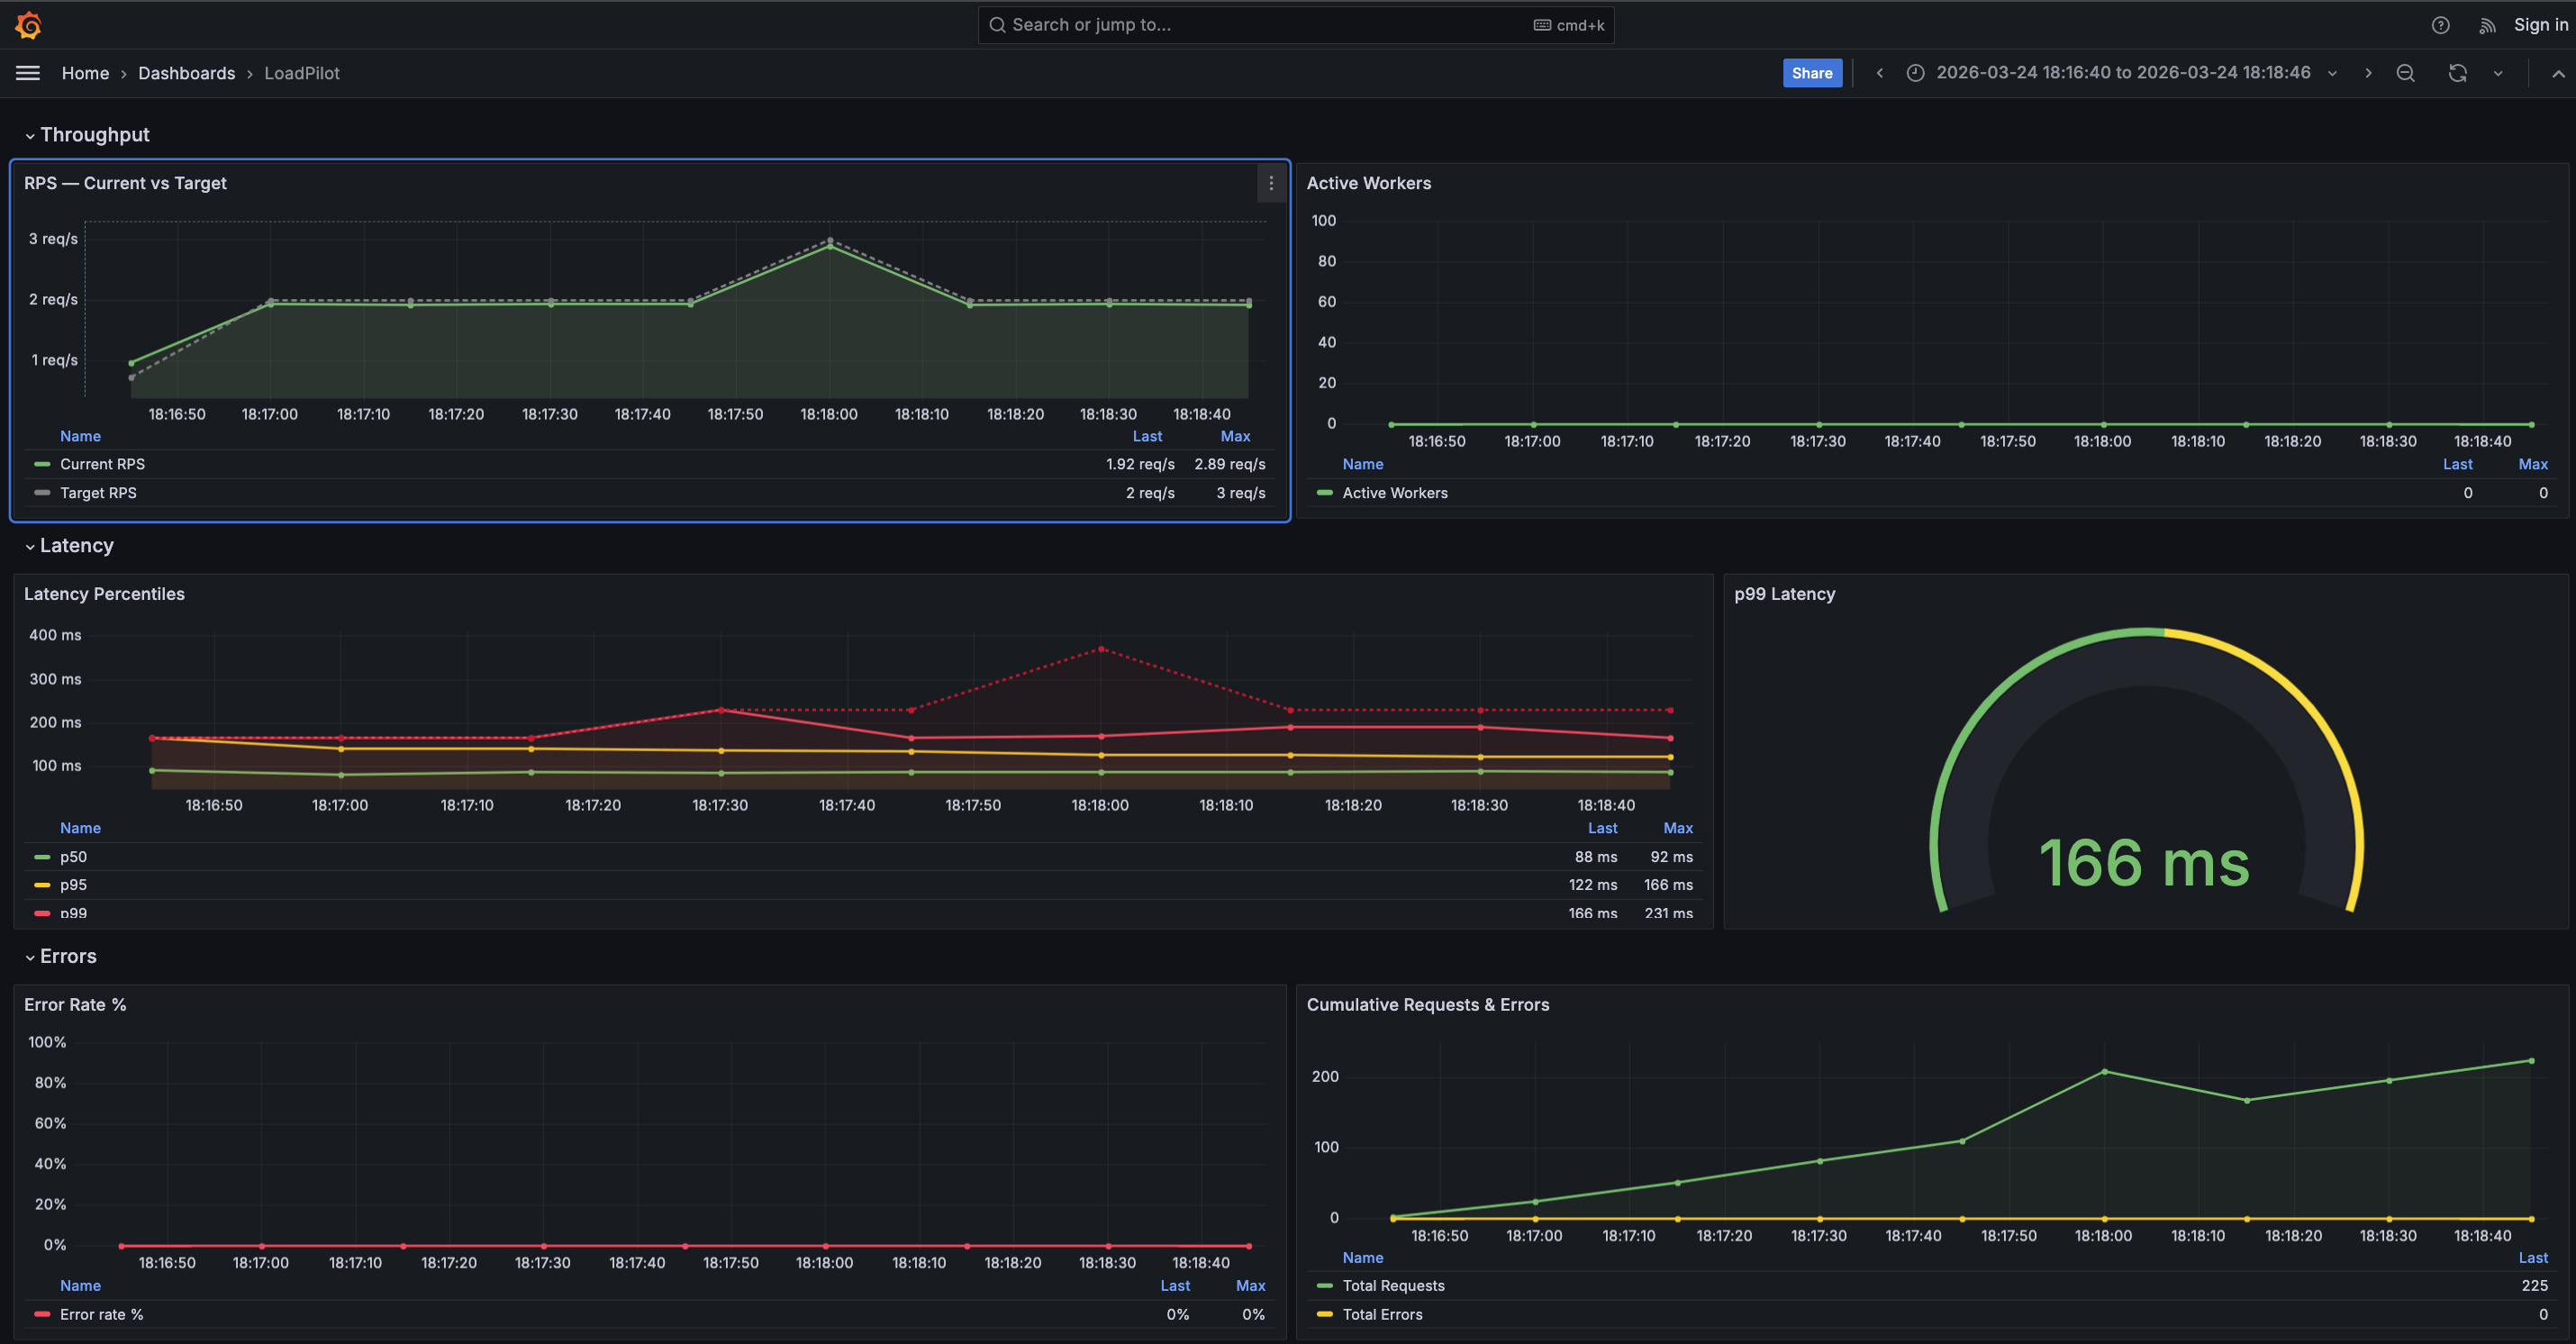
The dashboard has four sections:
| Section | Panels |
|---|---|
| Throughput | RPS — Current vs Target, Active Workers |
| Latency | Latency Percentiles (p50 / p95 / p99 / max), p99 gauge |
| Errors | Error Rate %, Cumulative Requests & Errors |
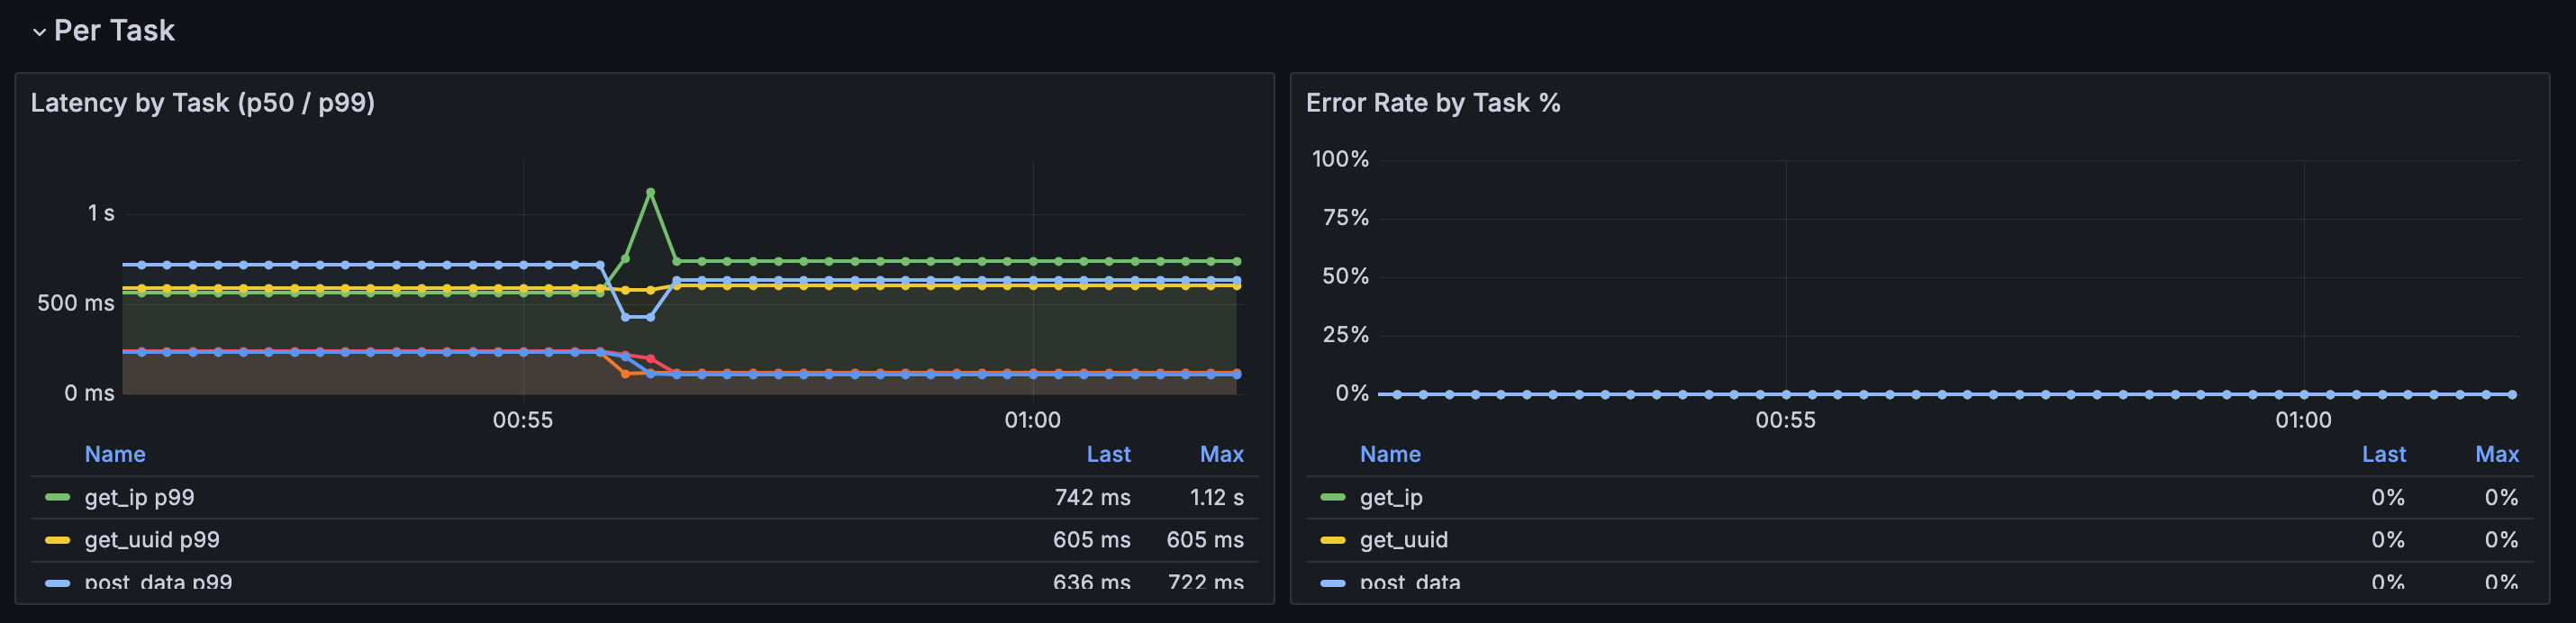
| Per Task | Latency by Task (p50 / p99), Error Rate by Task % |
The Per Task section is populated automatically when a scenario defines multiple
named @task methods. A $task template variable lets you filter by individual
endpoints. Tasks appear in the legend as soon as the first scrape completes.
Prometheus metrics
The coordinator exposes metrics at :9090/metrics during a run:
| Metric | Description |
|---|---|
loadpilot_current_rps | Observed request rate |
loadpilot_target_rps | Configured target RPS |
loadpilot_active_workers | Active VUser threads |
loadpilot_latency_p50_ms | p50 latency (ms) |
loadpilot_latency_p95_ms | p95 latency (ms) |
loadpilot_latency_p99_ms | p99 latency (ms) |
loadpilot_latency_max_ms | Max latency (ms) |
loadpilot_requests_total | Cumulative request count |
loadpilot_errors_total | Cumulative error count |
Per-task metrics
When a scenario has named tasks the coordinator also emits per-task metrics with
a task label:
| Metric | Description |
|---|---|
loadpilot_task_requests_total{task="..."} | Cumulative requests for this task |
loadpilot_task_errors_total{task="..."} | Cumulative errors for this task |
loadpilot_task_latency_p50_ms{task="..."} | p50 latency for this task (ms) |
loadpilot_task_latency_p99_ms{task="..."} | p99 latency for this task (ms) |
loadpilot_task_latency_mean_ms{task="..."} | Mean latency for this task (ms) |
Task names come from the method names of @task-decorated functions in your
scenario class.
Local setup (single machine)
loadpilot run scenarios/checkout.py --target https://api.example.com
The coordinator starts automatically. Forward Prometheus and open Grafana:
# Grafana ships embedded in the HTML report — open after the run:
open results/report.html

# Or run Prometheus + Grafana separately and point them at :9090
Kubernetes (Helm)
The Helm chart deploys Prometheus and Grafana with the dashboard pre-provisioned. See Development → Helm Chart for install instructions.
# Forward Grafana to localhost
kubectl port-forward -n loadpilot svc/loadpilot-grafana 3000:3000
Then open http://localhost:3000 — login admin / <adminPassword>.
Coordinator in-cluster (recommended)
Deploy the coordinator as a persistent pod so Prometheus can scrape it from inside the cluster — no host networking hacks required:
# Build and load the coordinator image
docker build -f engine/Dockerfile.coordinator -t loadpilot-coordinator:local .
kind load docker-image loadpilot-coordinator:local --name <cluster-name>

# Deploy with coordinator enabled
helm upgrade loadpilot cli/loadpilot/charts/loadpilot \
  -n loadpilot --reuse-values \
  --set coordinator.enabled=true \
  --set coordinator.image=loadpilot-coordinator \
  --set coordinator.tag=local \
  --set coordinator.imagePullPolicy=Never

# Port-forward coordinator API and run via it
kubectl port-forward -n loadpilot svc/loadpilot-coordinator 8080:8080
loadpilot run scenarios/checkout.py \
  --target https://api.example.com \
  --coordinator-url http://localhost:8080
Prometheus scrapes loadpilot-coordinator:9090 in-cluster automatically when
coordinator.enabled=true.
Coordinator running locally (alternative)
To scrape a coordinator running on the host machine:
helm upgrade loadpilot cli/loadpilot/charts/loadpilot \
  --set monitoring.coordinator.scrapeTarget=host.docker.internal:9090
Benchmark
How to reproduce the LoadPilot benchmark results.
What is tested
Four scenarios:
- Precision — all tools target 500 RPS for 30s. Measures how accurately each tool holds the target RPS and what latency overhead the load generator itself adds.
- Max throughput — each tool runs at maximum capacity for 30s. Measures the throughput ceiling on a single machine.
- PyO3 precision (LoadPilot only) — measures the cost of enabling Python callbacks (
on_start,check_*) at 500 RPS. - PyO3 max throughput (LoadPilot only) — measures the ceiling of different PyO3 architectures and optimisations.
Setup
Requirements:
- Docker with Compose v2 (
docker compose, notdocker-compose) - Python 3.x (for the report script)
Tools under test:
Target server: Rust/axum echo server built and run in Docker. Endpoints:
POST /auth/login→{"access_token": "tok"}(used byon_start)GET /api/user→{"id": 1, "name": "bench"}(main task endpoint)GET /health→{"status": "ok"}
All containers share the same Docker bridge network. Tools run sequentially with a 10s cooldown between runs.
Running
cd bench
./run.sh
This will:
- Build the target server and LoadPilot Docker images
- Start the target server
- Run each tool sequentially (8 runs total)
- Generate
results/report.html
First run takes longer — Rust compilation is cached after that.
To run a single profile:
cd bench

# Precision
docker compose --profile loadpilot-precision run --rm loadpilot-precision
docker compose --profile k6-precision       run --rm k6-precision
docker compose --profile locust-precision   run --rm locust-precision

# Max throughput
docker compose --profile loadpilot-max      run --rm loadpilot-max
docker compose --profile k6-max            run --rm k6-max
docker compose --profile locust-max        run --rm locust-max

# PyO3 — precision
docker compose --profile loadpilot-pyo3-onstart run --rm loadpilot-pyo3-onstart
docker compose --profile loadpilot-pyo3-full    run --rm loadpilot-pyo3-full

# PyO3 — max throughput
docker compose --profile loadpilot-pyo3-max-onstart run --rm loadpilot-pyo3-max-onstart
docker compose --profile loadpilot-pyo3-max-full    run --rm loadpilot-pyo3-max-full

# PyO3 — batch API
docker compose --profile loadpilot-pyo3-batch5 run --rm loadpilot-pyo3-batch5

# Regenerate report from existing results
python3 report.py
Results
Precision — 500 RPS target, 30s constant
| Tool | RPS actual | p50 | p99 | Errors | CPU avg | CPU peak | Mem peak |
|---|---|---|---|---|---|---|---|
| LoadPilot (PyO3) | 478 | 4ms | 15ms | 0% | 14% | 108% | 68 MB |
| k6 | 491 | 8ms | 118ms | 0% | 129% | 140% | 59 MB |
| Locust | 498 | 150ms | 1500ms | 0% | 88% | 119% | 85 MB |
CPU % is relative to one core (200% = two cores fully busy). LoadPilot runs in PyO3 mode with
on_start(login) andcheck_*(assertion per task) — a realistic scenario with Python callbacks.
LoadPilot and k6 hold the target accurately. Locust reaches the RPS but its Python/GIL scheduler adds significant latency (p99 ≥ 1500ms at only 500 RPS). LoadPilot uses 9× less CPU than k6 at the same load.
Max throughput — 30s constant, no artificial cap
| Tool | RPS | p50 | p99 | Errors | CPU avg | CPU peak | Mem peak |
|---|---|---|---|---|---|---|---|
| LoadPilot (PyO3) | 2205 | 11ms | 38ms | 0% | 165% | 179% | 105 MB |
| k6 | 1799 | 14ms | 175ms | 0% | 212% | 229% | 107 MB |
| Locust | 677 | 100ms | 170ms | 0% | 117% | 122% | 50 MB |
LoadPilot runs in PyO3 mode with on_start + check_*. It delivers 1.2× k6 and 3.3× Locust at max throughput. Per CPU: LoadPilot ≈ 13.4 RPS/core vs k6 ≈ 8.5 RPS/core — roughly 1.6× better CPU efficiency.
PyO3 precision — 500 RPS, on_start + optional check_*
| Architecture | RPS actual | p50 | p99 | CPU avg | Mem peak | Notes |
|---|---|---|---|---|---|---|
| Static (no callbacks) | 499 | 3ms | 11ms | 24% | 43 MB | Rust only |
| + on_start | 486 | 2ms | 5ms | 77% | 74 MB | login per VUser |
| + on_start + check_* | 478 | 4ms | 15ms | 14% | 68 MB | assertion per task |
Adding Python callbacks at 500 RPS has near-zero latency cost.
PyO3 max throughput — optimisation experiments
| Approach | HTTP RPS | p50 | p99 | CPU avg | Mem peak | Notes |
|---|---|---|---|---|---|---|
asyncio.run_until_complete | 1591 | — | — | — | — | historical baseline |
coro.send(None) fast path | 2289 | 11ms | 37ms | 190% | 115 MB | current async task impl |
sync def task | 2487 | 22ms | 67ms | 167% | 116 MB | no asyncio overhead |
async task + check_* | 2205 | 11ms | 38ms | 165% | 105 MB | check_*(self, status_code, body) |
client.batch(5) | 3385 | 14ms | 34ms | 147% | 79 MB | pure Rust JoinSet |
| Static ceiling (no Python) | 3494 | 18ms | 537ms | 115% | 76 MB | reference |
client.batch(N) reaches 97% of static mode at batch size 5.
Methodology notes
Why Docker? Reproducible on any machine with Docker. The bridge network adds a small fixed overhead equally for all tools, so relative comparisons remain valid.
Why sequential runs? Running tools simultaneously would saturate the target server and mix results. Sequential runs with a 10s cooldown give each tool a clean slate.
Resource measurement
CPU and memory are sampled via docker stats --no-stream every 1 second. CPU % is relative to one core (100% = one core fully busy). Memory is peak RSS reported by the Docker cgroup. The target server is excluded.
Architecture
Overview
CLI (Python)
  load scenario file
  introspect @scenario classes
  pre-run each @task with MockClient → extract URL + method
  detect on_start / check_* → enable PyO3 bridge
  build JSON plan → spawn coordinator binary
        │
        ▼ stdin (JSON)
Coordinator (Rust / tokio)
  token-bucket scheduler (50ms ticks)
        │
        ├── Static mode (no Python callbacks)
        │     reqwest async HTTP → record success/error
        │     body not read (no check_* to feed)
        │
        └── PyO3 mode (on_start / check_* / async tasks / batch present)
              one OS thread per VUser — persistent, no per-task spawn overhead
              Python::attach per message only (~1–5µs channel overhead)
              RustClient (PyO3 pyclass) passed to Python task
              py.detach(|| reqwest HTTP) — GIL released during I/O
              GIL re-acquired only for Python callback execution
              async def tasks driven via coro.send(None) fast path
              — avoids asyncio scheduling overhead for sync-body coroutines
              client.batch([...]) — N concurrent requests, one PyO3 call
              — py.detach() + tokio JoinSet, GIL free for entire batch
              — 97% of static ceiling at batch size 5
        │
        ├── stdout JSON lines (1/sec) → CLI live dashboard
        └── :9090/metrics → Prometheus / Grafana
Static vs PyO3 mode
The coordinator runs in one of two modes, selected automatically by the CLI:
Static mode — pure Rust, maximum throughput. Activated when the scenario has
no on_start, on_stop, or check_* methods. The coordinator fires HTTP requests
directly via reqwest without touching Python at runtime. No GIL, no thread overhead.
PyO3 mode — activated when any of the following are present:
on_start/on_stoplifecycle hookscheck_{task}assertion methodsasync deftask functionsclient.batch()calls
In PyO3 mode the coordinator spawns one OS thread per virtual user. Each thread
holds a persistent Python interpreter attachment (Python::attach once per task
message, not once per thread). HTTP I/O releases the GIL via py.detach(), so all
VUser threads run their HTTP requests concurrently even under Python’s GIL.
PyO3 bridge details
GIL strategy
VUser thread (OS thread, persistent)
  Python::attach                ← GIL acquired once per task message
    call task method(client)    ← Python executes task body
      py.detach()               ← GIL released
        reqwest HTTP            ← concurrent with all other VUser threads
      GIL re-acquired           ← back in Python callback
    call check_{task}(status, body)   ← Python assertion
  Python released               ← GIL free until next task message
Async task fast path
async def tasks are driven with coro.send(None) rather than
asyncio.run_until_complete. For sync-body coroutines (the common case where the
task body doesn’t contain real await expressions) this avoids the asyncio
scheduler entirely — roughly 10µs vs 200µs per coroutine. The coordinator
automatically falls back to run_until_complete when coro.send(None) raises
StopIteration before the coroutine is exhausted, i.e. when real await is used.
check_* implementation
JSON is pre-parsed inside py.detach() (pure Rust, no GIL) and stored in a cache
on the response object. When check_{task} is called, it receives a plain Python
int (status code) and a plain Python dict (pre-built from the parsed JSON) —
no wrapper object, no descriptor-protocol overhead. This adds only ~4% latency vs
a task with no check method.
client.batch() implementation
client.batch([...]) dispatches N HTTP requests concurrently via a tokio JoinSet
inside a single py.detach() block. The GIL is released for the entire batch —
PyO3 overhead is paid once per N requests rather than once per request. At batch
size 5 this reaches 97% of static-mode ceiling.
Metrics pipeline
The coordinator emits one JSON line per second to stdout. The Python CLI parses
these lines and renders the live TUI dashboard. Each line is an AgentMetrics
object:
{
  "timestamp_secs": 1234567890.0,
  "elapsed_secs": 12.5,
  "current_rps": 100.2,
  "target_rps": 100.0,
  "requests_total": 1250,
  "errors_total": 0,
  "active_workers": 1,
  "phase": "steady",
  "latency": {
    "p50_ms": 12.0,
    "p95_ms": 28.0,
    "p99_ms": 41.0,
    "max_ms": 203.0,
    "min_ms": 4.0,
    "mean_ms": 14.2
  }
}
Latency percentiles use a histogram with power-of-two bucket boundaries. In distributed mode, histograms from all agents are merged before computing percentiles — this gives exact (not estimated) percentiles across the fleet.
Simultaneously, the coordinator exposes the same metrics on :9090/metrics in
Prometheus format for live Grafana dashboards.
Development
Prerequisites
- Python 3.12+
- Rust 1.85+ (
rustuprecommended) - uv
Building from Source
git clone https://github.com/VladislavAkulich/loadpilot.git
cd loadpilot

# Build Rust coordinator + agent
cd engine && cargo build --release && cd ..

# Install Python CLI in editable mode
cd cli && uv pip install -e .
The coordinator binary is picked up from engine/target/release/coordinator
by the CLI at runtime when running from source.
Running Tests
The test suite is split into three layers:
| Layer | Files | Requires | Time |
|---|---|---|---|
| Unit | all except test_integration.py, test_e2e_smoke.py | nothing | ~1s |
| Integration | test_integration.py | coordinator binary | ~15s parallel |
| E2e | test_e2e_smoke.py | coordinator + agent binaries | ~25s parallel |
Unit tests
No Rust build required:
cd cli
uv sync --extra dev
just test-unit
# or: uv run pytest tests/ -v --ignore=tests/test_e2e_smoke.py --ignore=tests/test_integration.py
Integration + E2e tests
Build both binaries first, then run all subprocess-based tests in parallel:
cd engine && cargo build --package coordinator --package agent
cd ../cli
just test-e2e
# or: uv run pytest tests/test_integration.py tests/test_e2e_smoke.py -v -n auto --timeout=120
Tests that require the coordinator binary skip automatically with a clear message if the binary is not found.
All Python tests
just test-py
# or: cd cli && uv run pytest tests/ -v
Coverage is reported automatically after every run (configured in pyproject.toml).
HTML coverage report is written to cli/htmlcov/index.html.
Rust tests + coverage
cd engine

# run unit tests (coordinator + agent)
cargo test

# agent-only tests
cargo test --package agent

# unit tests + coverage summary (requires cargo-llvm-cov)
cargo cov

# unit tests + HTML coverage report → target/llvm-cov/html/index.html
cargo cov-html
The agent test suite (engine/agent/src/runner.rs) covers:
| Test | What it guards |
|---|---|
budget_low_rps_regression | round() → 0 bug at low RPS; budget accumulation fix |
budget_matches_target_rps_over_one_second | Correct request rate for 1–100 RPS |
budget_residual_bounded | Budget stays in [0, 1) — no runaway accumulation |
task_urls_overrides_task_default_url | Per-VUser URL from on_start reaches agents |
task_urls_falls_back_to_task_url_when_absent | Fallback to task’s static URL |
empty_vuser_configs_uses_task_url | Pool-size=0 path |
ramp/constant/step/spike_mode_* | All load profile modes |
pick_task_respects_weights | Weighted task selection |
ramp_total_duration_* | Duration includes ramp-up for Ramp mode |
Install cargo-llvm-cov if not present:
cargo install cargo-llvm-cov
rustup component add llvm-tools-preview
CI Pipeline
CI runs on every push to main and on pull requests that touch engine/, cli/, or .github/workflows/. Changes to docs, README, or justfile do not trigger CI.
| Job | What it runs | Rust build |
|---|---|---|
lint | ruff, cargo fmt, cargo clippy | debug (cached) |
audit | cargo audit, pip-audit | debug (cached) |
rust | cargo llvm-cov (unit tests + coverage) | debug (cached) |
python | unit tests only (no coordinator needed) | none |
e2e | integration + e2e tests, -n auto, --timeout=120 | release (cached) |
The e2e job uses release binaries so tests run at production speed and timing-sensitive assertions are reliable.
Security audits
just audit
# cargo audit  — checks Rust dependencies against RustSec advisory database
# pip-audit    — checks Python dependencies against OSV/PyPI advisories
Helm Chart
A Helm chart for deploying the distributed agent stack to Kubernetes is located at
cli/loadpilot/charts/loadpilot/. It is not yet published to a Helm repository
but can be installed directly from the source tree.
What the chart deploys
| Component | Description |
|---|---|
loadpilot-nats | NATS broker (single-node, LoadBalancer) |
loadpilot-agent | N agent pods — connect to NATS and wait for plans |
loadpilot-prometheus | Prometheus scraping coordinator metrics |
loadpilot-grafana | Grafana with pre-provisioned LoadPilot dashboard |
Local install (kind / minikube)
# Build and load agent image
docker build -f Dockerfile.agent -t loadpilot-agent:local .
kind load docker-image loadpilot-agent:local --name <cluster-name>

# Install chart
helm install loadpilot cli/loadpilot/charts/loadpilot \
  --namespace loadpilot --create-namespace \
  --set agent.image=loadpilot-agent \
  --set agent.tag=local \
  --set agent.imagePullPolicy=Never \
  --set monitoring.coordinator.scrapeTarget=""

# Forward NATS + Grafana
kubectl port-forward -n loadpilot svc/loadpilot-nats 4222:4222
kubectl port-forward -n loadpilot svc/loadpilot-grafana 3000:3000
Run a test against the in-cluster agents:
loadpilot run scenarios/checkout.py \
  --target https://api.example.com \
  --nats-url nats://127.0.0.1:4222 \
  --external-agents <replicas>
Key values
| Value | Default | Description |
|---|---|---|
agent.replicas | 3 | Number of agent pods |
agent.imagePullPolicy | IfNotPresent | Use Always with latest tag in prod |
agent.livenessProbe.enabled | true | Restart pod if agent process hangs |
agent.readinessProbe.enabled | true | Mark pod ready once process is up |
imagePullSecrets | [] | Secrets for private registries |
nats.service.type | LoadBalancer | NodePort for bare-metal / minikube |
monitoring.enabled | true | Deploy Prometheus + Grafana |
monitoring.coordinator.scrapeTarget | host.docker.internal:9090 | Set "" in cloud (coordinator not in cluster) |
monitoring.grafana.adminPassword | admin | Stored in a Kubernetes Secret |
monitoring.prometheus.persistence.enabled | false | Enable PVC for Prometheus data |
monitoring.grafana.persistence.enabled | false | Enable PVC for Grafana data |
Enabling persistence
helm upgrade loadpilot cli/loadpilot/charts/loadpilot \
  --set monitoring.prometheus.persistence.enabled=true \
  --set monitoring.prometheus.persistence.size=20Gi \
  --set monitoring.grafana.persistence.enabled=true
Private registry
helm install loadpilot cli/loadpilot/charts/loadpilot \
  --set "imagePullSecrets[0].name=my-registry-secret"
Verifying the deployment
After install or upgrade, run the built-in smoke tests:
helm test loadpilot --namespace loadpilot
| Test | What it checks |
|---|---|
loadpilot-test-nats | TCP connectivity to NATS on port 4222 |
loadpilot-test-prometheus | Prometheus /-/healthy returns 200 |
loadpilot-test-grafana | Grafana /api/health returns 200 |
Installing from OCI registry
After a release tag is pushed, the chart is published automatically to
ghcr.io/vladislavakul ich/charts/loadpilot:
helm install loadpilot oci://ghcr.io/vladislavakul ich/charts/loadpilot \
  --version 0.1.7 \
  --namespace loadpilot --create-namespace
Running coordinator in-cluster
The coordinator can run inside the cluster in serve mode (--serve flag). Enable it via:
helm install loadpilot cli/loadpilot/charts/loadpilot \
  --set coordinator.enabled=true \
  --set coordinator.image=loadpilot-coordinator \
  --set coordinator.tag=local \
  --set coordinator.imagePullPolicy=Never \
  --set "coordinator.serveAgents=3" \
  --set monitoring.coordinator.scrapeTarget=""
In serve mode the coordinator listens on 0.0.0.0:8080:
| Endpoint | Description |
|---|---|
POST /run | Accept ScenarioPlan JSON, stream ndjson metrics. Returns 409 if a test is already running. |
GET /healthz | Readiness probe — returns ok |
By default coordinator.enabled: false because the coordinator image must be built separately from the agent image.
Benchmark
cd bench
./run.sh
Runs LoadPilot, k6, and Locust sequentially against a Rust/axum echo server in Docker
and generates results/report.html. See Benchmark for full details.
Project Structure
loadpilot/
  cli/                    ← Python package (pip install loadpilot)
    loadpilot/
      cli.py              ← CLI entry point, _build_plan()
      dsl.py              ← @scenario, @task, VUser, _scenarios registry
      models.py           ← Pydantic models: ScenarioPlan, AgentMetrics, ...
      client.py           ← LoadClient (httpx wrapper for on_start)
      _bridge.py          ← MockClient (used by _build_plan to extract URLs)
      report.py           ← HTML report generator
    tests/
      _helpers.py         ← Shared fixtures: MockServer, run_coordinator, free_port
      test_models.py      ← Unit: ScenarioPlan / TaskPlan validation
      test_dsl.py         ← Unit: @scenario / @task DSL
      test_cli_plan.py    ← Unit: _build_plan() scenario selection logic
      test_bridge.py      ← Unit: MockClient / PyO3 bridge helpers
      test_client.py      ← Unit: LoadClient
      test_report.py      ← Unit: HTML report generation
      test_integration.py ← Integration: Python plan → coordinator subprocess
      test_e2e_smoke.py   ← E2e: all run modes + graceful shutdown (parallel)

  engine/                 ← Rust workspace
    coordinator/src/
      coordinator.rs      ← Main run loop, token-bucket scheduler
      python_bridge.rs    ← PyO3 bridge, VUser threads, RustClient
      metrics.rs          ← Histogram, AgentMetrics, JSON serialisation
      plan.rs             ← ScenarioPlan deserialization + validation
      distributed.rs      ← NATS integration, agent coordination
      broker.rs           ← Embedded NATS broker
    agent/                ← Standalone agent binary (for remote machines)

  bench/                  ← Benchmark suite
    scenarios/            ← LoadPilot / k6 / Locust scenario files
    run.sh                ← Orchestration script
    report.py             ← HTML report generator

  docs/                   ← Documentation